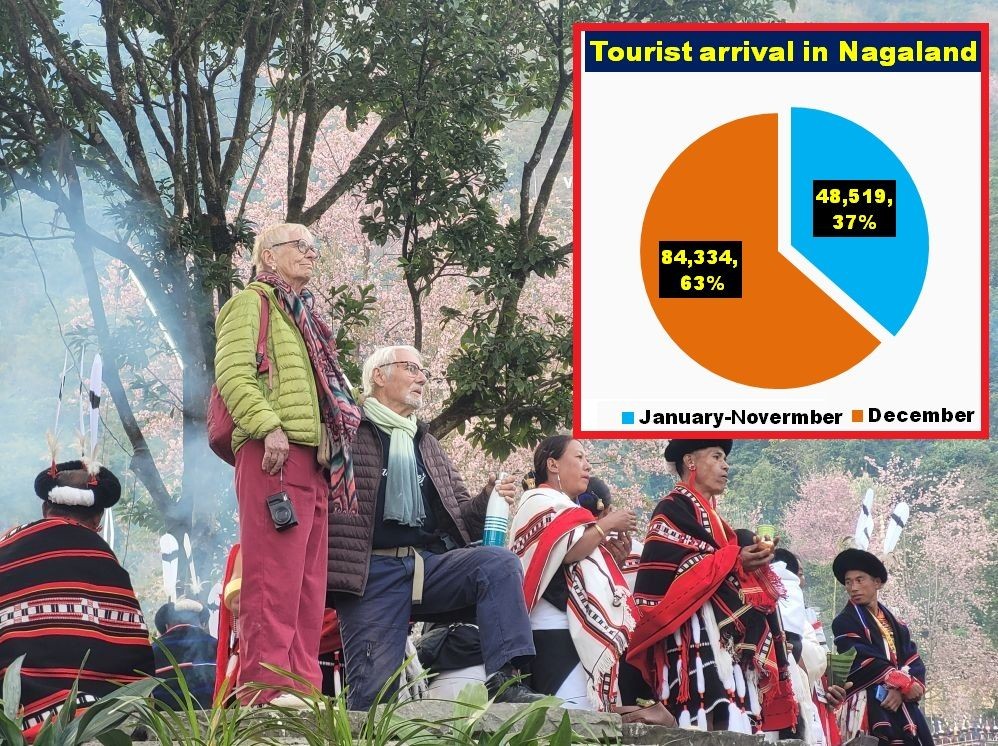
Tourists along with performers watch the proceedings of the Hornbill Festival at the Naga Heritage Village, Kisama, in December 2025. (Morung File Photo)
Hornbill drives nearly half of annual visitors
Moa Jamir
Dimapur | March 14
Tourism in Nagaland continues to show modest overall growth but remains heavily concentrated around a single month and a single event—the Hornbill Festival held annually from December 1–10.
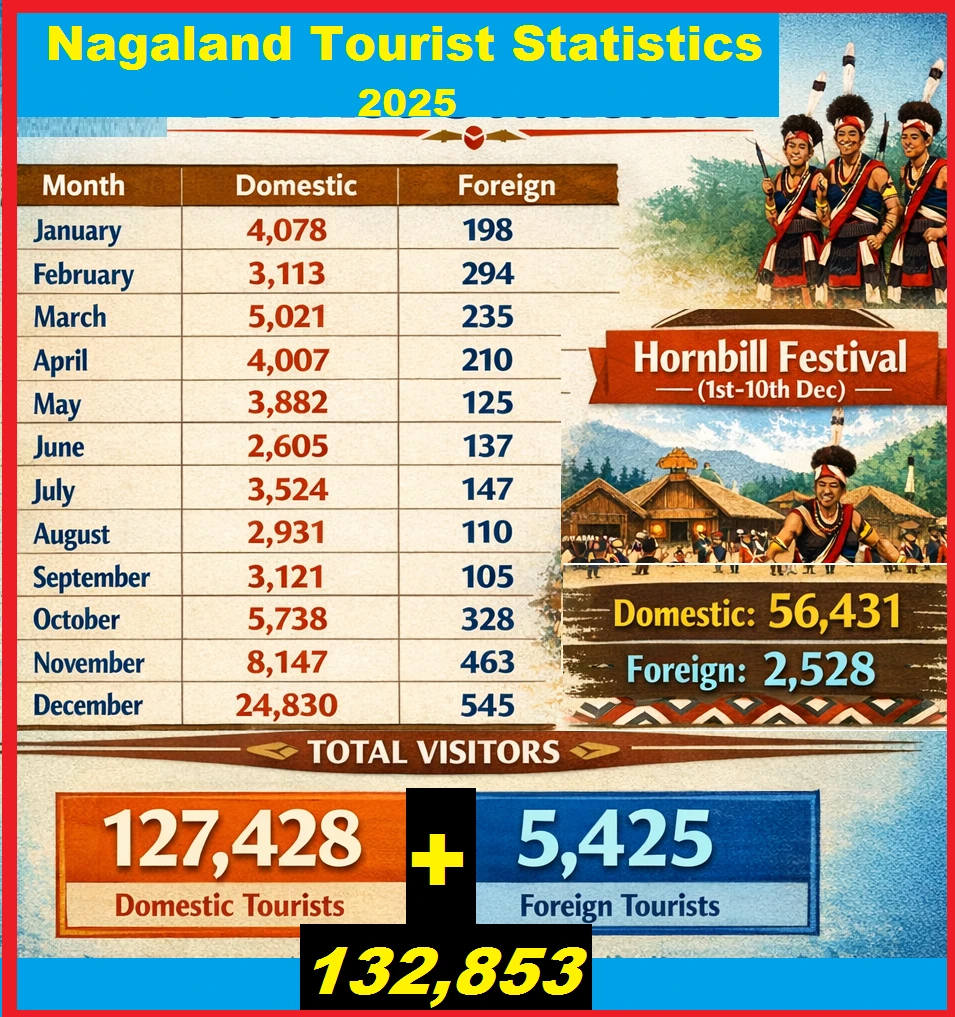
Official statistics for 2025 recorded a total of 132,853 tourist arrivals, including 127,428 domestic and 5,425 foreign visitors, marking a 1.31% increase from the 131,139 arrivals recorded in 2024.
While domestic arrivals grew slightly by 1.52%, foreign tourist numbers declined by 3.52% during the same period, according to data provided in the Annual Administrative Report 2025–26 of the Tourism Department, Nagaland.
However, a closer examination of the monthly data suggests that Nagaland’s tourism economy continues to revolve overwhelmingly around the December Hornbill Festival, raising questions about the sector’s year-round sustainability.
December dominates tourism calendar
In December 2025, Nagaland recorded 24,830 domestic and 545 foreign tourists, but when the Hornbill Festival-specific figures are included, the numbers rise sharply to 81,261 domestic and 3,073 foreign visitors for the month.
The Hornbill Festival alone attracted 56,431 domestic and 2,528 foreign tourists, accounting for roughly 44% of the entire year’s domestic tourist footfall and nearly 47% of all foreign arrivals.
The contrast with the rest of the year is stark.
Between January and November, domestic tourist arrivals averaged about 4,197 visitors per month, while foreign arrivals averaged 264 per month.
However, the ten-day Hornbill Festival period alone draws 56,431 domestic tourists during the festival, more than 21 times the total domestic arrivals recorded in June (2,605), the lowest month in 2025.
Likewise, the foreign tourist turnout during the festival alone is nearly 19 times higher than the lowest monthly foreign arrivals recorded in September (105).
Seasonal patterns visible
The monthly data also revealed clear seasonal patterns in tourism activity.
A noticeable pre-festival build-up occurs in October and November, with domestic tourist arrivals rising to 5,738 in October and 8,147 in November, significantly higher than most months earlier in the year.
Foreign tourist arrivals follow a similar trend, peaking outside December in November (463) and October (328), suggesting that many international visitors arrive early to explore the state before the main festival rush.
By contrast, the lean season typically falls between June and September, when domestic tourist arrivals consistently remain below 3,200 per month.
Overall, the tourist arrivals between January and November stood at 48,519 (36.5%), while in December, boosted by the Hornbill Festival, recorded 84,334 visitors, accounting for about 63.5% of the annual flow to the State.
Pattern largely unchanged from 2024
The concentration of tourism in December is not a new phenomenon. In 2024, Nagaland recorded 131,139 tourist arrivals, but over 63% of all visitors arrived in December alone, according to the Tourism Department’s earlier report.
Between January and November 2024, the State recorded just 48,299 tourist arrivals, averaging about 4,390 visitors per month.
However, 82,840 visitors were recorded in December, nearly twice the combined total of the previous eleven months.
The Hornbill Festival in 2024 alone attracted 58,744 visitors, accounting for about 44.8% of the State’s annual tourist footfall that year.
While the dominance continued in 2025, the share of annual visitors concentrated during the festival period has declined slightly compared to 2024, suggesting a modest spread of tourist arrivals across other months, even as the festival continues to anchor the State’s tourism calendar.
It may also be noted that foreign nationals are required to obtain a Protected Area Permit (PAP) to enter Nagaland. However, the requirement was briefly relaxed during the Hornbill Festival period, which may have influenced the surge in foreign tourist arrivals during that time.
Further, the notable increase in domestic visitor numbers during the Hornbill Festival and December could partly reflect more systematic monitoring and registration of tourists during the event, processes that are less consistently undertaken during other periods of the year. The Annual Administrative Report, however, does not specify the reasons behind the observed fluctuations in tourist arrivals.
Tourism Dept bats for ‘Master Plan’
Despite the seasonal imbalance, the Tourism Department noted that the tourism industry in Nagaland has been expanding gradually over the past decade, with increasing interest from both domestic and international travellers.
The report highlighted that global demand for travel to remote destinations with pristine environments is growing and that Nagaland could benefit by developing tourism around its natural landscapes, cultural heritage and adventure potential.
It suggested that an accurate and comprehensive tourism database could help lay the groundwork for a Tourism Master Plan, focusing on the development of tourism circuits, infrastructure, accommodation facilities, transportation services and wayside amenities.
Spreading tourism infrastructure across districts would also help ensure that economic benefits from tourism are more widely distributed across the State, the report noted.
Nagaland Tourist Inflow Statistics 2025
Month | Domestic | Foreign | |
1 | January | 4,078 | 198 |
2 | February | 3,113 | 294 |
3 | March | 5,021 | 235 |
4 | April | 4,007 | 210 |
5 | May | 3,882 | 125 |
6 | June | 2,605 | 137 |
7 | July | 3,524 | 147 |
8 | August | 2,931 | 110 |
9 | September | 3,121 | 105 |
10 | October | 5,738 | 328 |
11 | November | 8,147 | 463 |
12 | December | 24,830 | 545 |
Hornbill Festival (1st-10th Dec) | 56,431 | 2,528 | |
TOTAL | 127,428 | 5,425 | |
Source: Annual Administrative Report 2025-26, Tourism Department Nagaland
Tourist Inflow Comparison (2024 vs. 2025)
Category | 2024 Total | 2025 Total | Percentage Change |
Domestic | 125,516 | 127,428 | +1.52% Increase |
Foreign | 5,623 | 5,425 | -3.52% Decrease |
Grand Total | 131,139 | 132,853 | +1.31% Increase |
Source: Annual Administrative Reports, Tourism Department Nagaland